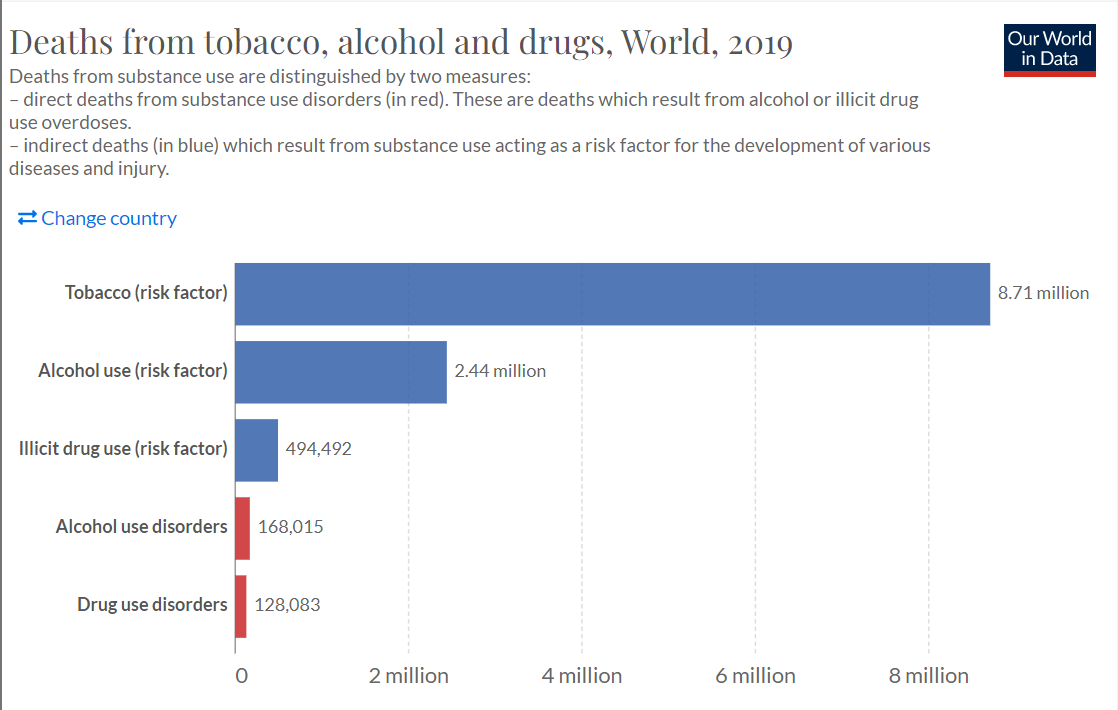
I downloaded Death from tobacco, alcohol and drugs from Our World in Data I chose this data because many younger generations do not understand the importance of tobacco, and other drugs. This data is from 2019.
This is the link to the data.
The following code chunk loads the package I will use to read in and prepare the data for analysis
- Read the data in
- Use glimpse to see the names and types of the columns
glimpse(substances_risk_factor_vs_direct_deaths)
Rows: 6,840
Columns: 8
$ Entity                                                                                <chr> ~
$ Code                                                                                  <chr> ~
$ Year                                                                                  <dbl> ~
$ `Deaths - Drug use disorders - Sex: Both - Age: All Ages (Number)`                    <dbl> ~
$ `Deaths - Alcohol use disorders - Sex: Both - Age: All Ages (Number)`                 <dbl> ~
$ `Deaths - Cause: All causes - Risk: Tobacco - Sex: Both - Age: All Ages (Number)`     <dbl> ~
$ `Deaths - Cause: All causes - Risk: Drug use - Sex: Both - Age: All Ages (Number)`    <dbl> ~
$ `Deaths - Cause: All causes - Risk: Alcohol use - Sex: Both - Age: All Ages (Number)` <dbl> ~
#view(substances_risk_factor_vs_direct_deaths)
- Use output from glimpse (and View) to prepare the data for analysis
Use filter to extract the rows that I want to keep: Year >= 2019 world
Select the columns to keep: drug use disorders, Alcohol use disorders, cause tobacco, cause drug use, cause alcohol use
Assign the output to direct_deaths
Display the first 5 rows of direct_deaths
direct_deaths  <-

  substances_risk_factor_vs_direct_deaths %>%
  filter(Year == 2019, Entity == "World") %>%
  rename(drug_use_disorders = 4,
         Alchohol_use_disorders = 5,
         Cause_Tobacco = 6,
         Cause_Drug_Use = 7,
         Cause_Alchohol_Use = 8)  %>%
  select(4:8)

direct_deaths
# A tibble: 1 x 5
  drug_use_disorders Alchohol_use_disord~ Cause_Tobacco Cause_Drug_Use
               <dbl>                <dbl>         <dbl>          <dbl>
1             128083               168015       8708898         494492
# ... with 1 more variable: Cause_Alchohol_Use <dbl>
The graph matches the information, as only 5 rows are depicted.
Add a picture.
See how to chage the width on the R markdown Cookbook
 Project compleated with Nick Dean
write_csv(direct_deaths, file = "direct_deaths.csv")