- Packages I will use to read in and plot the data
- Read the data in from part 1
Interactive Graph
- Start with the data
- Match E-charts with description
- Created bar chart with e-bar
- Use e_tooltip to add a tooltip that will display based on the axis values.
- Use e_title to add a title, subtitle, and link to subtitle
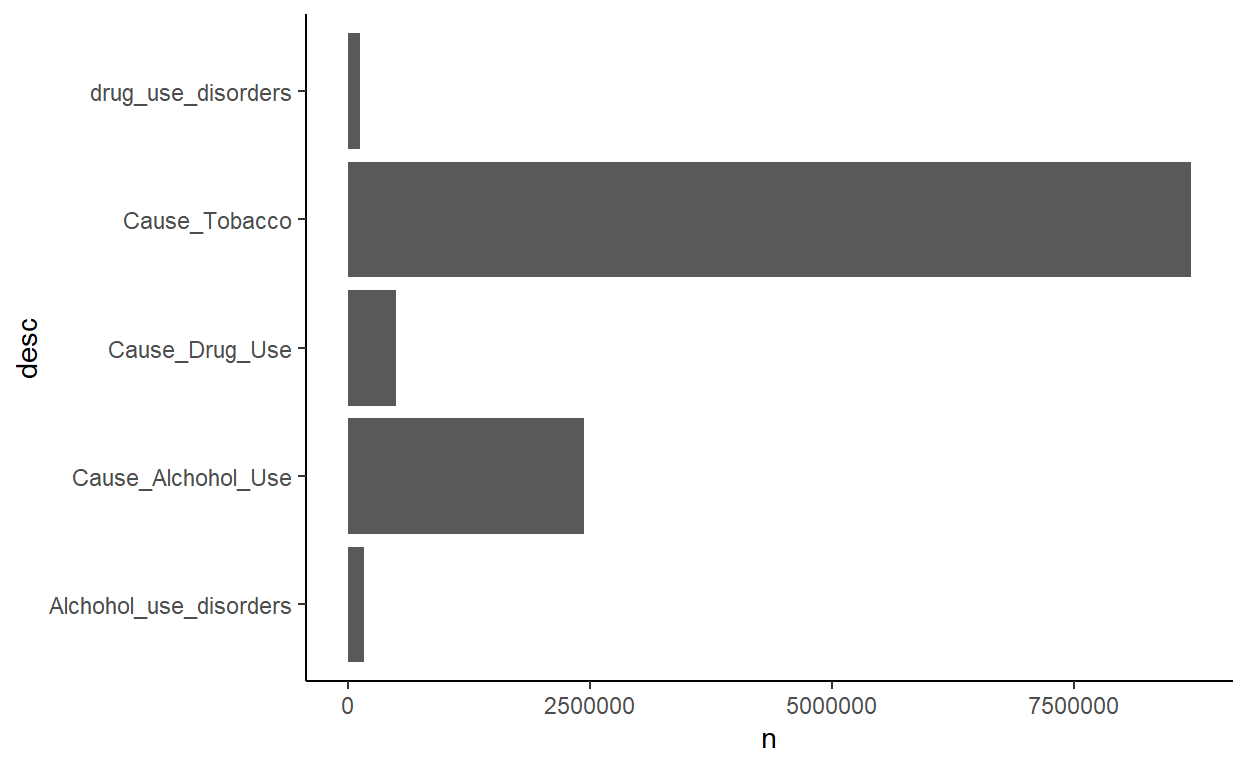
Static Graph
- Start with the data
- Use ggplot to create a new object
- Use pivot_longer to display colums 1-5 and label values as “desc” and “n”.
- Use coord_flip to relocate the graph’s position.
- theme_classic sets the theme
- theme(legend.position = “bottom”) puts the legend at the bottom of the plot
- labs sets the y axis label, fill = NULL indicates that the fill variable will not have the labelled Deaths
$y
[1] "millions"

$fill
NULL

attr(,"class")
[1] "labels"
This graph shows the importance of drug related education, inorder to lower deaths, and save lives.